
 by
by CBS announced a new showrunner today for The Late Show with Stephen Colbert, moving Eric Licht from his executive producer gig on the morning shift for CBS This Morning to help steer the late-night ship into more comfortable long-term territory.
Before you rush to write your hot-take thinkpieces about how this marks Colbert’s Late Show as an epic fail following David Letterman, let me take you back about 24 years — when just four months after Jay Leno took over The Tonight Show from Johnny Carson, NBC fired Leno’s executive producer and began shaking things up in Burbank. Then they changed the set. Leno caught a couple of big-get guests and made the most of those interviews, leading to what constituted viral in a pre-Web world. And a couple of years later, Leno overtook Letterman in the ratings for good.
But it’s interesting to also consider just how much has changed in television and TV viewing habits since then.
How much of late-night TV do we actually watch when it airs, versus how much we watch and share online in YouTube segments?
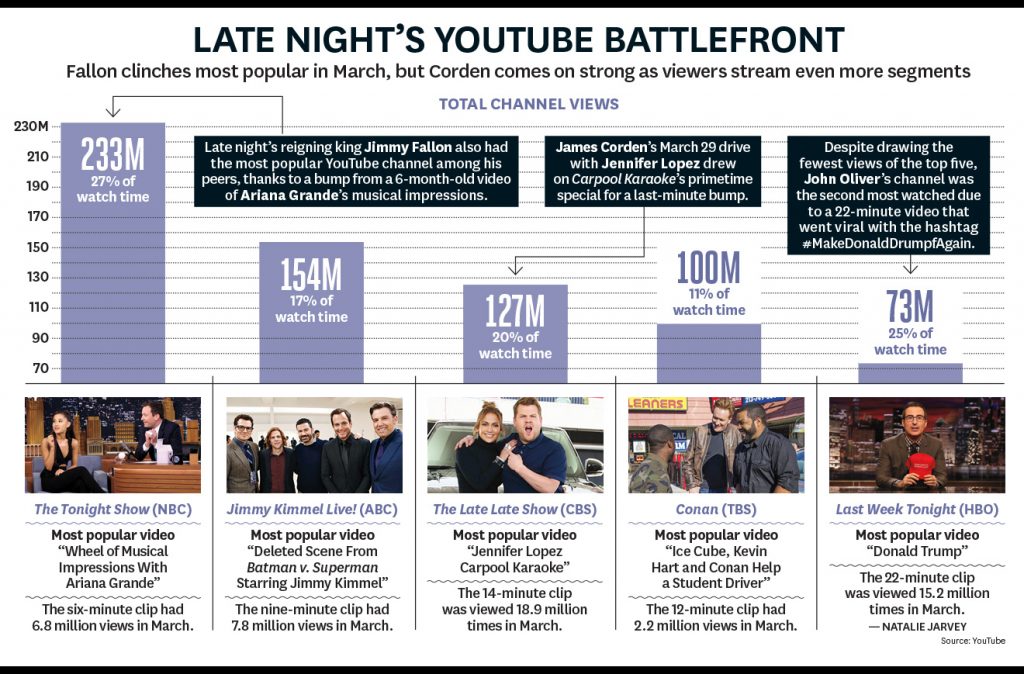
The Hollywood Reporter just crunched the numbers of the various late-night talkers and their YouTube subscriber bases last week. THR found that Jimmy Fallon’s Tonight Show is crushing in terms of sheer YouTube views, while John Oliver’s substantively longer segments each Sunday on HBO’s Last Week Tonight are wracking up major minutes.
Here are the YouTube subscriber numbers for each show, as of April 13, 2016 (note: Comedy Central doesn’t separate out its shows on individual YouTube channels):
- The Tonight Show Starring Jimmy Fallon: 10,639,867 subscribers (most popular: Lip Sync Battle with Emma Stone, 69,704,786 views)
- Jimmy Kimmel Live: 7,619,987 (most popular: Jimmy Surprises Bieber Fan, 64,111,382 views)
- Late Late Show with James Corden: 4,666,465 (most popular: Adele Carpool Karaoke, 96,295,149 views)
- Conan: 3,898,617 (most popular: Ice Cube, Kevin Hart And Conan Help A Student Driver – CONAN on TBS, 29,220,681 views)
- Last Week Tonight with John Oliver: 3,203,620 (most popular: Last Week Tonight with John Oliver: Donald Trump (HBO), 24,118,446 views)
- The Late Show with Stephen Colbert: 1,076,413 (most popular: Stephen Moderates An All-Trump Debate, 7,101,029 views)
- Real Time with Bill Maher: 537,946 (Real Time with Bill Maher: Ben Affleck, Sam Harris and Bill Maher Debate Radical Islam (HBO), 3,045,551 views)
- Late Night with Seth Meyers: 429,504 (most popular: Seth Brings Jon Snow to a Dinner Party – Late Night with Seth Meyers, 10,282,270 views)
- Full Frontal with Samantha Bee: n/a (most popular: Sausage Party | Full Frontal With Samantha Bee | TBS, 3,265,398 views)
But what about actual TV on the TV viewers?
Colbert and Corden have this week off. The most recent full week that all of the major players aired originals together, Feb. 22-26, 2016, saw the average live viewership tallies ranked like so, by total audience (title, rating in ages 18-49, overall viewers):
- Fallon: 0.88 and 3,340,000
- Colbert: 0.46 and 2,300,000
- Kimmel: 0.52 and 2,170,000
- Adult Swim (various 11:30-12:30): 0.73 and 1,560,000
- Seth Meyers: 0.44 and 1,550,000
- Nightline: 0.34 and 1,390,000
- James Corden: 0.29 and 1,210,000
- Adult Swim (various 12:30-1:30): 0.57 and 1,160
- Conan: 0.32 and 850
- Daily Show: 0.33 and 830
- Nightly Show: 0.23 and 570
And here’s an even more comprehensive look at just this Monday night in late-night, so you can see where your favorite shows stack up against what everybody else is watching at that hour or half-hour.
April 11, 2016 (all times Eastern, listed by rating in ages 18-49, then overall # of viewers)
10 p.m.
Blindspot (NBC) 1.4 and 5,530,000
NCIS: Los Angeles (CBS) 1.3 and 8,240,000
WWE Raw (USA) 1.2 and 3,427,000
Castle (ABC) 1.1 and 6,440,000
Teen Mom 2 (MTV) 0.9 and 1,596,000
Better Call Saul (AMC) 0.8 and 2,059,000
Real Housewives of Dallas (Bravo) 0.4 and 1,076,000
10:30 p.m.
House Hunters International (HGTV) 0.4 and 1,562,000
South Park (Comedy Central) 0.3 and 491,000
Full Frontal with Samantha Bee (TBS) 0.26 and 568,000
11 p.m.
Family Guy (Adult Swim) 1.0 and 1,973,000
Love & Hip Hop Atlanta 5 (VH1) 0.6 and 1,122,000
Teen Mom 2 aftershow (MTV) 0.63 and 1,053,000
Chrisley Knows Best (USA) [11:12 p.m.] 0.5 and 1,197,000
Tiny House Hunters (HGTV) 0.3 and 1,193,000
Friends (Nick at Nite) 0.3 and 890,000
The Daily Show with Trevor Noah (Comedy Central) 0.34 and 877,000
Street Outlaws: NOLA (Discovery) 0.3 and 785,000
SportsCenter Late (ESPN) (hour) 0.26 and 562,000
Watch What Happens Live (Bravo) 0.24 and 628,000
The Nightly Show with Larry Wilmore (Comedy Central) 0.22 and 538,000
Conan (TBS) 0.15 and 314,000
CNN Tonight (CNN) 0.13 and 657,000
Forensic Files (HLN): 409,000
The O’Reilly Factor (FOX News) 1,008,000
All in With Chris Hayes (MSNBC) 555,000
E! News (E!) 0.12 and 306,000
Sacramento Kings vs. Phoenix Suns (NBA-TV) 10:05-12:30 0.12 and 317,000
11:30 p.m.
The Tonight Show Starring Jimmy Fallon (NBC) 2.6
Jimmy Kimmel Live (ABC) 2.0
Late Show with Stephen Colbert (CBS) (repeat) 1.9
Family Guy (Adult Swim) 1.0 and 1,938,000
Vacation (HBO) 0.09 and 202,000
Friends (Nick at Nite) 0.4 and 1,024,000
Tiny House Hunters (HGTV) 0.4 and 1,252,000
Chrisley Knows Best (USA) [11:42 p.m.] 0.3 and 799,000
Midnight
Robot Chicken (Adult Swim) 0.6 and 1,235,000/0.6 and 1,084,000 [12:15 a.m.]
Black Ink Crew 4 (VH1) 0.4 and 927,000
Friends (Nick at Nite) 0.4 and 857,000
Tiny House Hunters (HGTV) 0.3 and 1,040,000
SportsCenter (ESPN) 0.26 and 562,000
@midnight (Comedy Central) 0.17 and 327,000
Baseball Tonight (ESPN2) 0.09 and 171,000
12:30 a.m.
Nightline (ABC) 1.2
Late Night with Seth Meyers (NBC) 1.2
Late Late Show with James Corden (CBS) (repeat) 0.9
NBA Tonight (ESPN2) 0.08 and 164,000
NBA postgame show (NBA) 0.07 and 207,000
Aqua Teen Hunger Force (Adult Swim) 0.5 and 980,000
Friends (Nick at Nite) 0.3 and 765,000
12:45 a.m. Squidbillies (Adult Swim) 0.5 and 933,000
1 a.m. Venture Brothers (Adult Swim) 0.5 and 897,000
1:35 a.m. Last Call with Carson Daly (NBC) 0.7
Sources: Nielsen ratings, plus information compiled by TV Newser, TV by the Numbers, ShowBuzzDaily and The Futon Critic from network press releases.